
Jake Buckner
Author
Most marketers can tell you their ROAS target. Far fewer can tell you their actual break-even point.
That gap is significant. If you don’t know exactly where break-even sits, every growth decision carries a level of uncertainty.
To manage that uncertainty, many experienced teams build in a safety buffer.
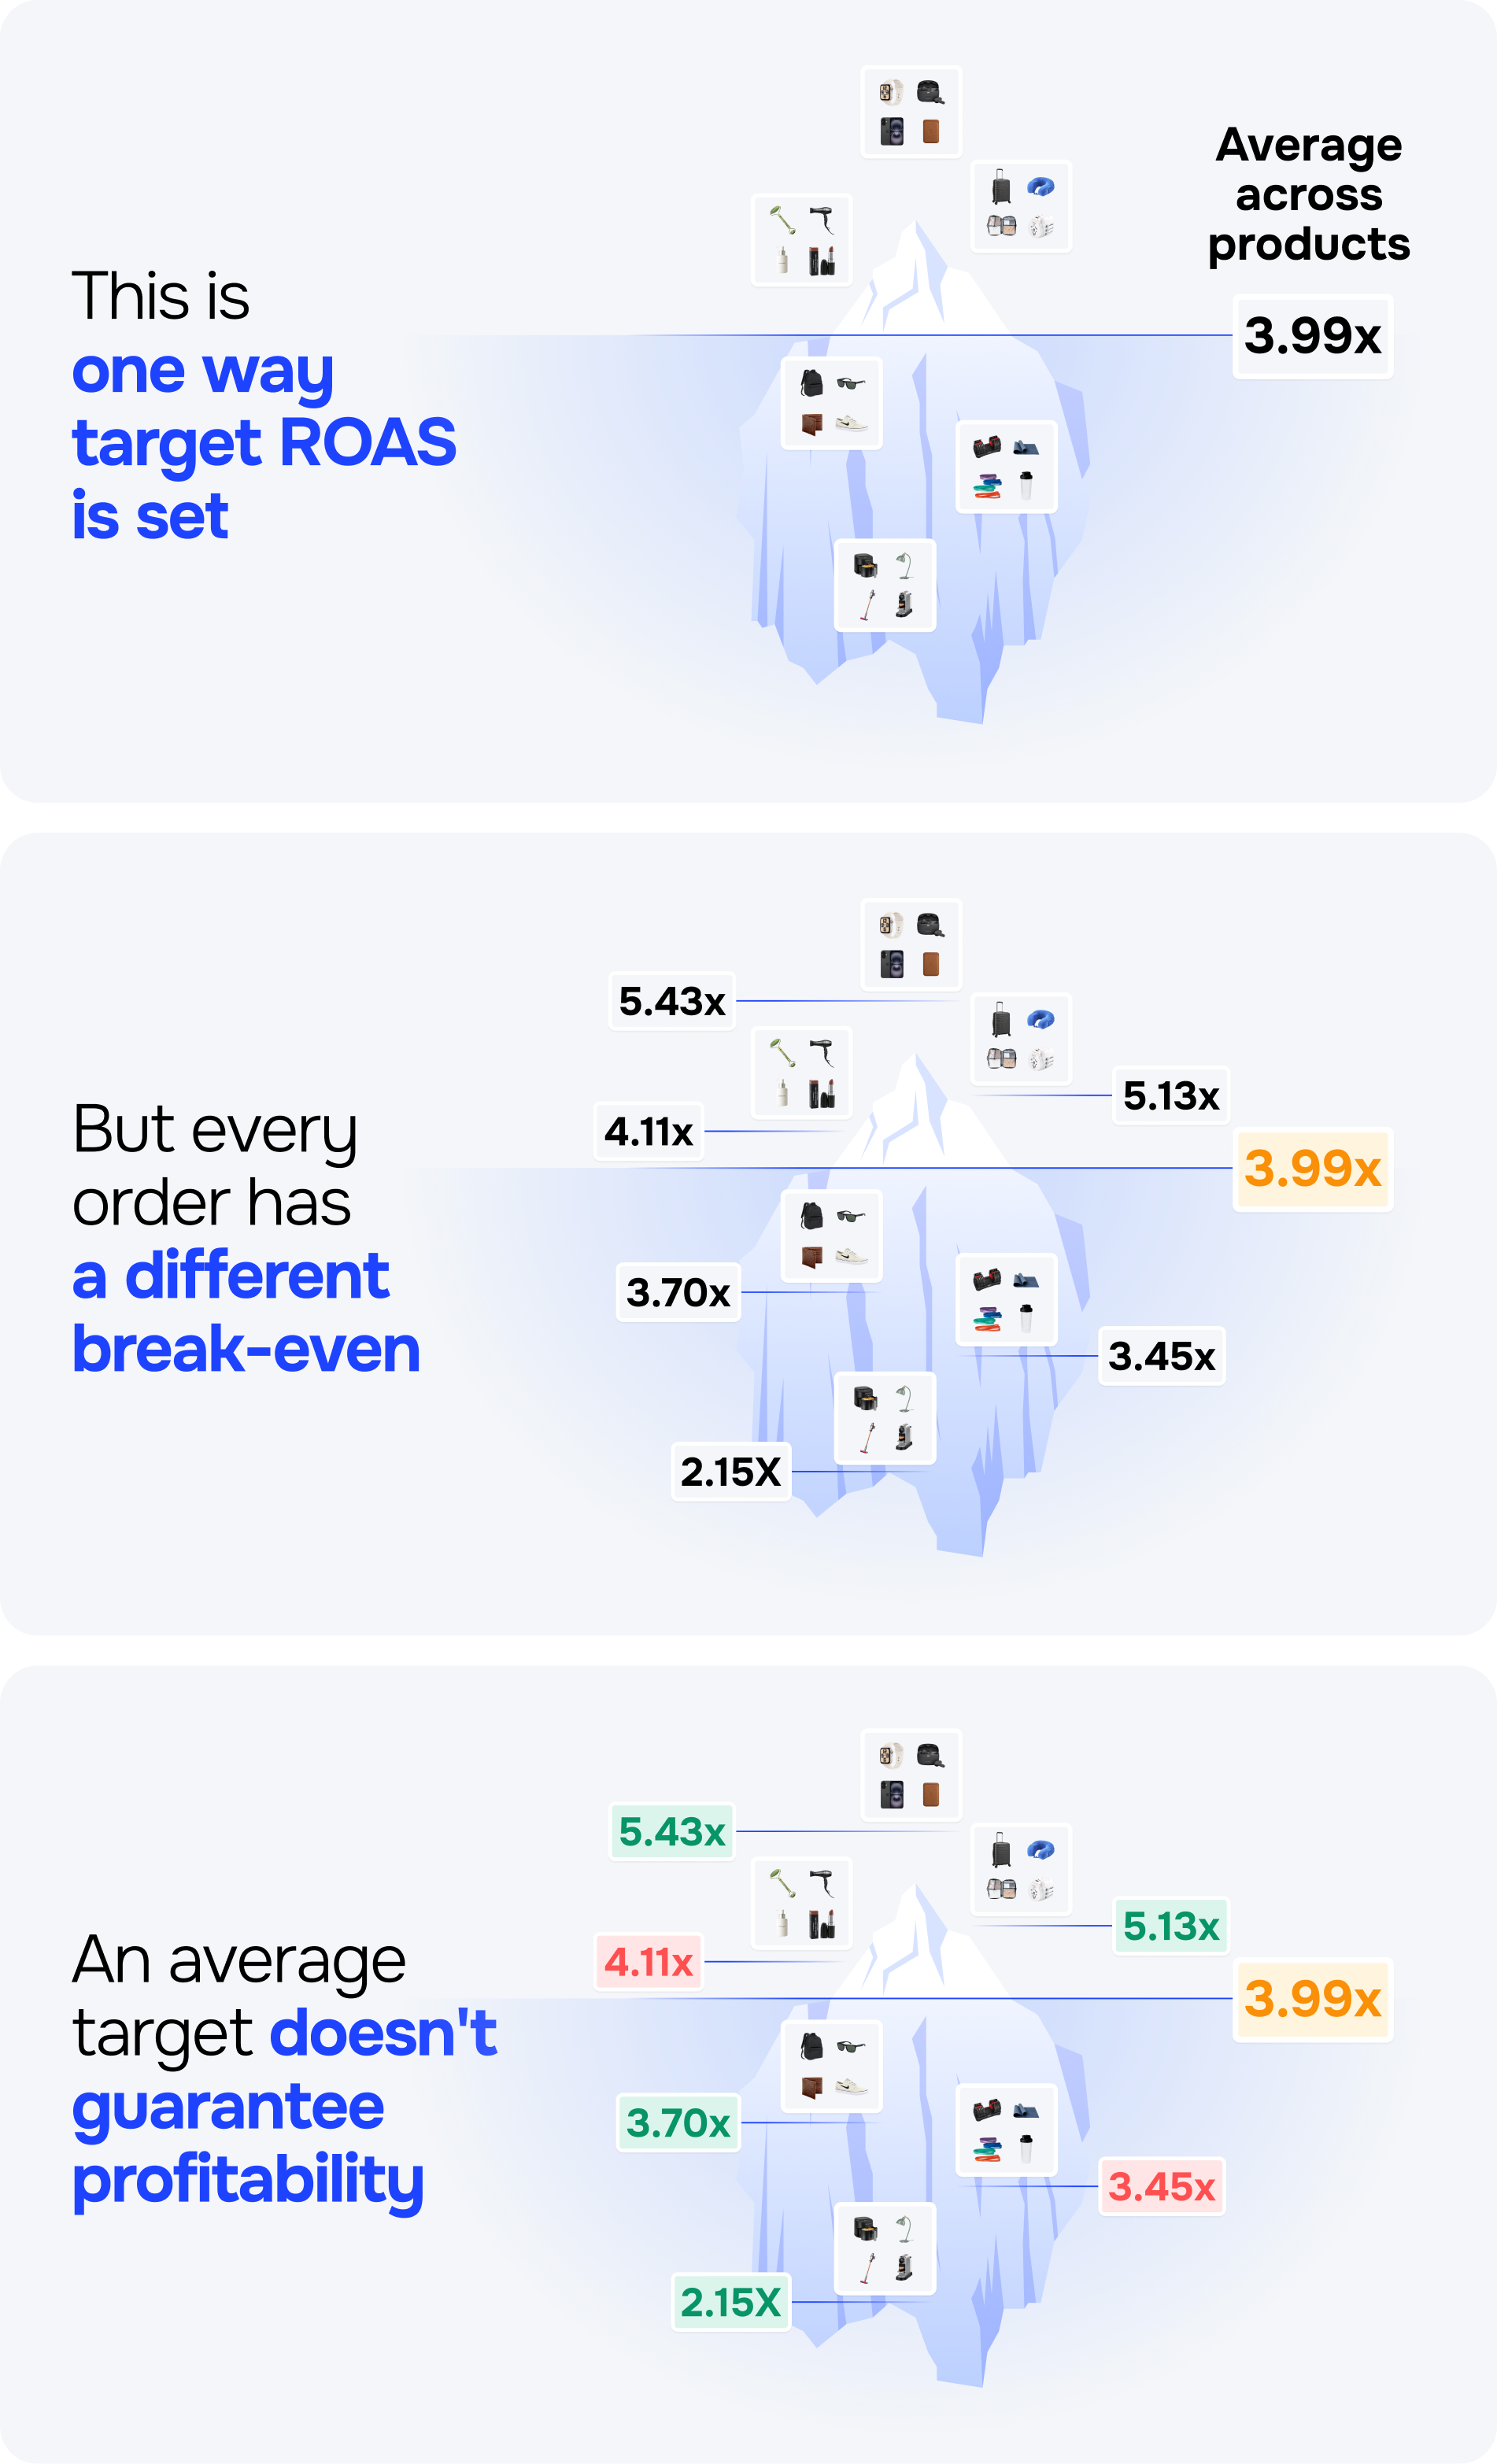
They look at their lowest margin products, estimate the ROAS required to break even, and apply a conservative target across the entire account. If some products need a ROAS of 5.0 to stay profitable, they may set the whole account to 5.5 just to be safe.
On the surface, this might sound responsible. In practice, it creates a significant opportunity cost.
By setting account-wide targets to protect your weakest margins, you end up holding back the products and campaigns that could scale profitably.
ROAS measures revenue, not profit. As a result, your true break-even point depends on variables the metric was never designed to measure, including:
As those variables change, your break-even ROAS changes with them. A target that made sense last quarter may no longer reflect current costs or current product performance.
Many teams are forced to rely on ROAS cushions, blended averages, and overcautious assumptions because they lack the data needed for precise targeting.
POAS® (Profit on Ad Spend) measures Gross Profit relative to ad spend. Because the relevant variable costs are already reflected in Gross Profit, profitability is measured directly rather than inferred from revenue.
Different products can have very different margins and costs, but once profitability is measured directly, the break-even benchmark remains the same: 1.
Instead of constantly recalculating whether a ROAS target is still “safe enough,” you have a universal benchmark that applies across campaigns, products, and channels.
Imagine two campaigns in the same account.
Campaign A shows a 4.5 ROAS. On a revenue dashboard, it looks healthy. But it’s selling lower-margin products with higher shipping costs. Once costs are accounted for, its POAS® is 0.79. Despite the strong ROAS, the campaign is losing money.
Campaign B shows a 2.5 ROAS. This may look underwhelming in a traditional report. But it’s selling higher-margin products with lower fulfillment costs. Its POAS is 1.71.
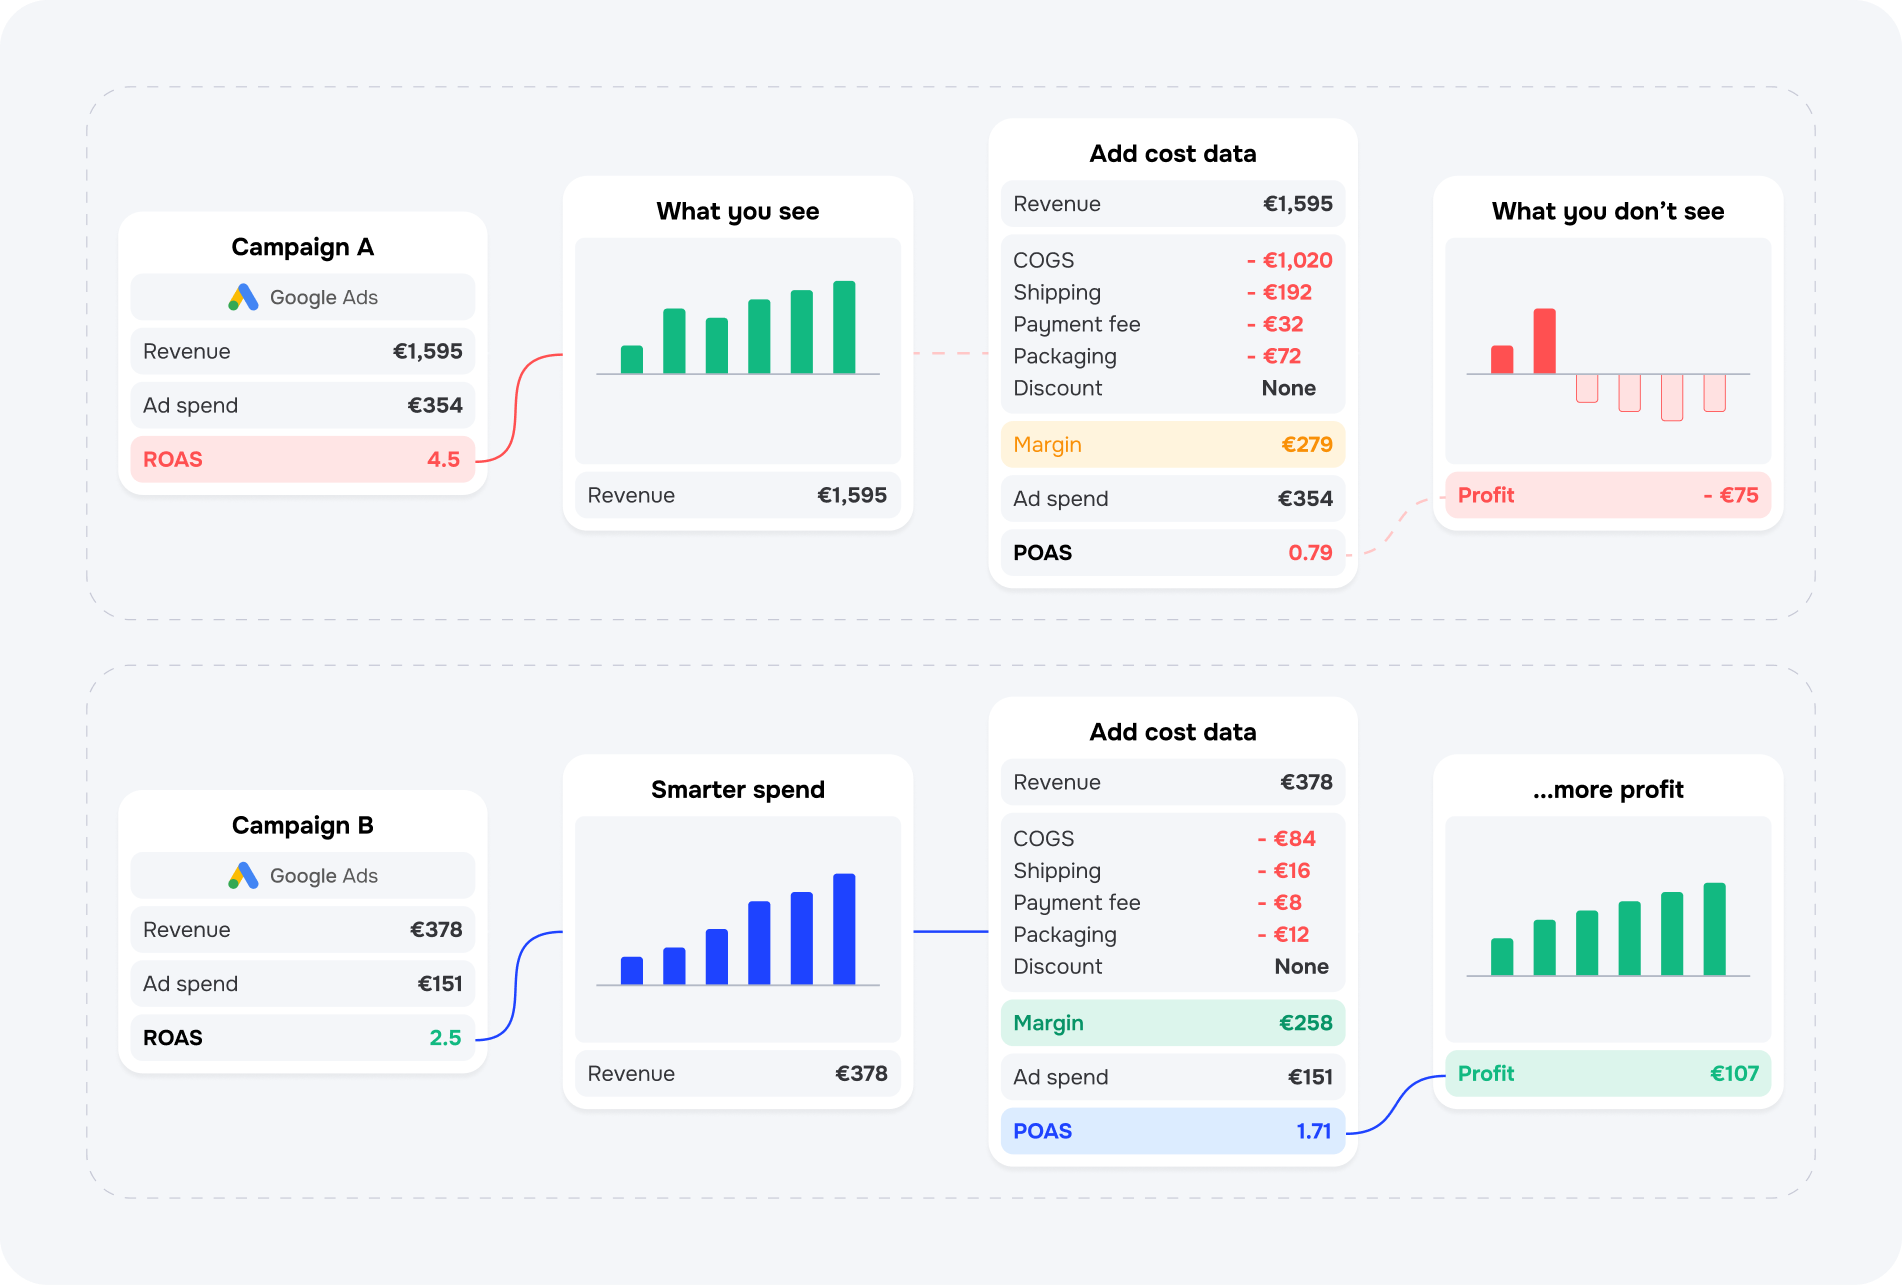
If you manage only through ROAS, Campaign A may receive more budget while Campaign B is held back.
That’s one example of the real cost of an unclear break-even point.
When break-even is difficult to define, teams naturally become more cautious. Budgets are reduced on campaigns that could grow profitably. Unprofitable campaigns continue longer than they should. Marketing and finance may look at the same results and draw different conclusions.
When break-even is fixed at 1, that friction starts to disappear.
Most performance metrics need layers of interpretation before they become useful. A fixed break-even point removes much of that necessity.
When you know exactly where break-even sits, you can move from defending a “safe” target to scaling a profitable business. That’s the real power of 1.

Get started today, no credit card required.

ProfitMetrics boosts your work with real-time profit insights on orders.