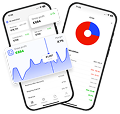
Greenpak had successfully scaled revenue, but understanding profitability still required lengthy manual analysis. Working with its agency Blend Analytics, the business implemented ProfitMetrics and restructured Google Ads around profitability and channel role. Following these changes, Greenpak increased Net Profit by 51% year over year, while reducing advertising spend by 10% in the same period.

Greenpak is a B2B ecommerce business supplying food packaging to restaurants, takeaways and coffee shops. Launched in 2019, the company sells approximately 500 SKUs.
When Greenpak adopted ProfitMetrics in September 2025, its performance marketing channels were mature and well optimized. Blend wanted a reliable, live view of profitability and a way to test Google Ads optimization based on Gross Profit rather than revenue.
Blend Analytics is a digital performance agency focused on improving client profitability. Its services span PPC, conversion rate optimization, SEO, analytics and ecommerce development, combining data and technical expertise to identify and prioritize improvements across the digital sales journey.
Profitability KPIs were modeled through painstaking analysis at each quarterly business review. Calculating Contribution Margins for new and existing customers required still more manual work.
When we asked the Blend team what made them realize they needed a better way to measure profitability, they had a specific moment in mind:

“Spending a day attempting to calculate new and existing customer contribution margins using Google Sheets!”

Josh Colbeck
Digital Performance Director
-
Blend Analytics

Revenue, customer acquisition and marketing efficiency ratio (MER) were already part of reporting. Blend needed to bring profitability metrics into regular decision-making without repeatedly rebuilding the analysis.
Greenpak’s Google Ads campaigns were split by product category.
“Unnecessary volume of campaigns meant bid models had less data to optimise with. This is particularly a challenge when variables such as seasonality, stock or competitor pricing changes performance. The bid models were often slow to optimise.”
- Josh Colbeck
Category splits also failed to reflect the products customers bought together. With an average of 2.5 SKUs per completed order, separating campaigns by category was not a viable way to optimize for the margins of mixed-product baskets.

*Figures shown are illustrative and do not represent actual client data
Blend connected Greenpak’s WooCommerce store to ProfitMetrics using the WooCommerce plugin and enabled ProfitMetrics’ Conversion Booster.
Reporting expanded to include Gross Profit, Contribution Margin and Net Profit. This made commercial performance easier to monitor and reduced the time spent on reporting and profitability modeling.
Contribution Margin visibility also changed ad scheduling. Greenpak had previously advertised only on working days. A lower weekend MER had made those days look less attractive, but the profit data showed that a small level of weekend spend could still generate Contribution Margin, helping cover fixed costs and contribute to Net Profit.
Blend extended advertising to seven days a week, using profitability data to assess the opportunity beyond MER alone.
After testing, Blend restructured Greenpak’s Google Ads account and fully adopted POAS® (Profit on Ad Spend) bidding in February 2026.
Using ProfitMetrics’ Gross Profit conversion actions, Blend sent Gross Profit values to Google Ads. Google Ads then used those values to guide bidding towards Gross Profit rather than revenue.
Instead of trying to manage margins by splitting campaigns into product categories, Blend could use the Gross Profit of each order to guide bidding. Bidding could prioritize sales generating more Gross Profit, rather than treating equal-revenue orders as equally valuable.
Year-over-year comparison: September 1–October 14, 2026 vs. September 1–October 14, 2025.
Net Profit margin increased from 8.16% to 11.53%, a gain of 3.37 percentage points. Total advertising spend fell by approximately 10% over the same comparison period.
These business-level results followed changes to bidding, account structure and ad scheduling. ProfitMetrics provided the profitability data Blend used to inform and evaluate those decisions.

Year-over-year dashboard: September 1–October 14, 2026 compared with September 1–October 14, 2025.
Reporting basis: Results are recorded in ProfitMetrics. Fixed expenses shown in the dashboard are unchanged across the two comparison periods.



-
Learn more about our agency partnerships


ProfitMetrics boosts your work with real-time profit insights on orders.